Beautiful.ai · Template Pages · Batch 1

Infographic Template page: Before & After

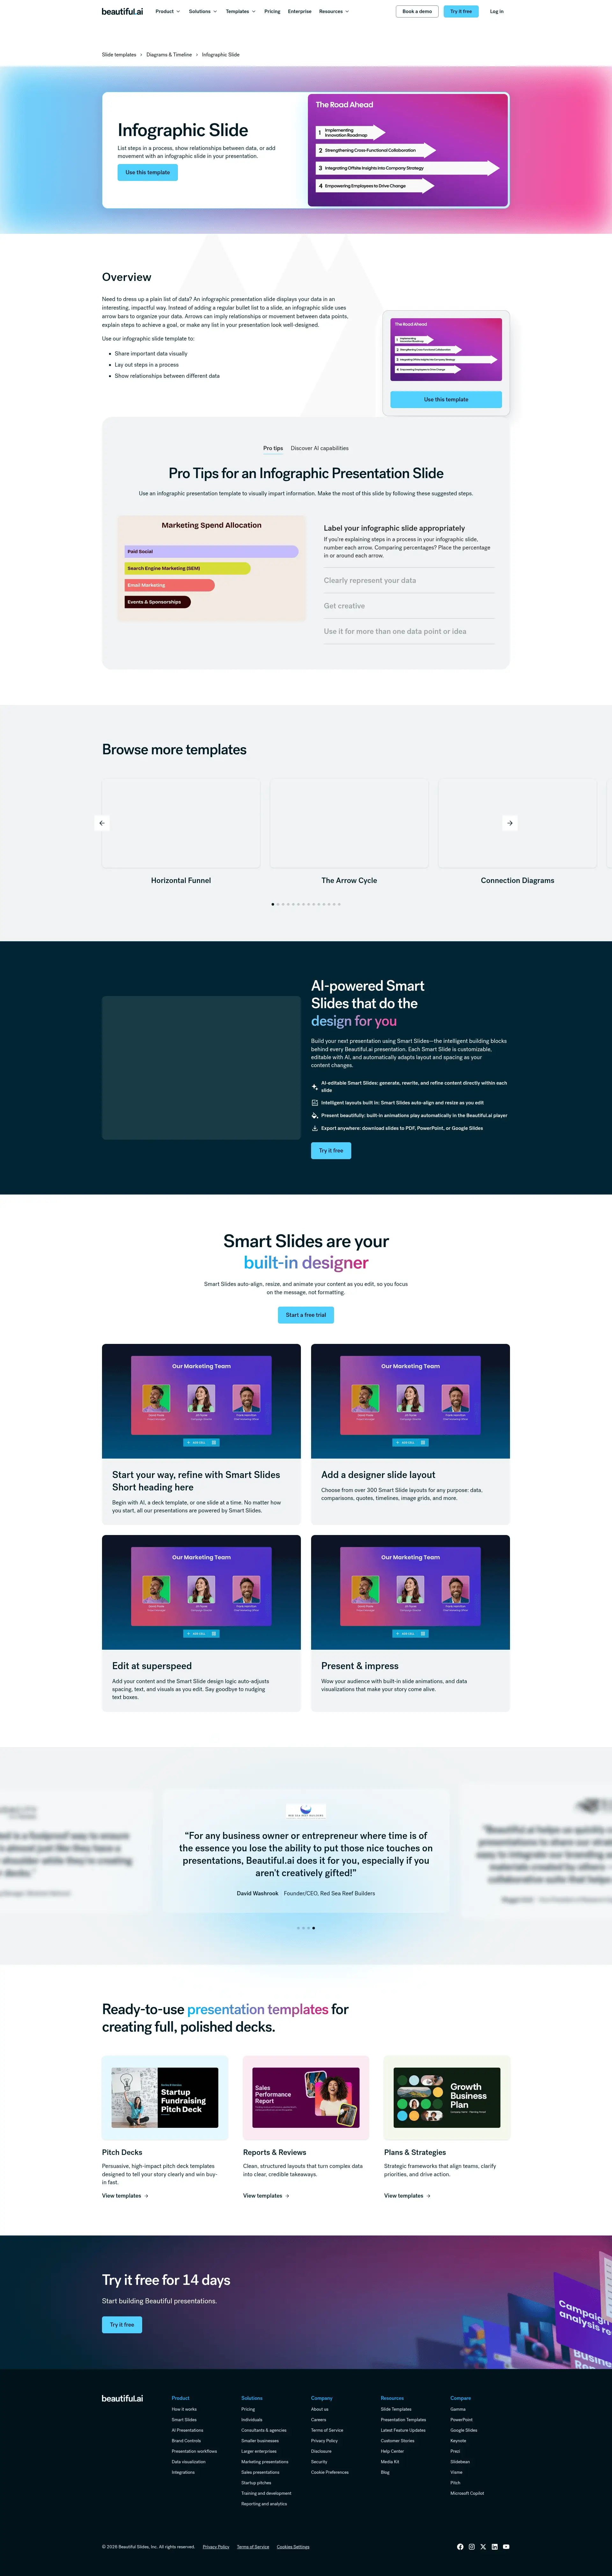
Two views of the same set of changes. Optimization Draft is the standard draft view, with the full before/after copy for every element in live page order and the paste-ready schema package. Annotated Before & After lays the same changes over a screenshot of the live page at beautiful.ai/templates/infographic, taken August 24; click a numbered marker to jump to its card. The full module spec behind every change is on the review hub.

Existing element, optimized New section, added Unchanged Click a marker to jump to its card.
Page URLhttps://www.beautiful.ai/templates/infographic
CategoryDiagrams & Timeline (breadcrumb: Slide templates › Diagrams & Timeline › Infographic Slide)
Head Terminfographic template
GSC BaselineNot surfacing for “infographic template”; those impressions go to a Beautiful.ai blog post
Proposed Title TagInfographic Template for Presentations | Beautiful.ai (53 chars)
Proposed Meta DescriptionStart from a designer-made infographic template, add your content by hand or let AI fill it in, then take the finished slide to PowerPoint or Google Slides. (156 chars)
SummaryThe page does not surface for “infographic template” at all; Google currently sends those impressions to a Beautiful.ai blog post. The title fix drops “Slide” and the doubled brand, the head term enters the H1 and meta, and the new modules build the page a template query can rank.
OptimizedH1
Before

Infographic Slide

After

Infographic Template

Why: The live H1 is “Infographic Slide.” The searcher typed “infographic template,” and the separate infographic-maker draft covers tool intent, so this page’s headline commits to the template head term.

OptimizedHero copy
Before

List steps in a process, show relationships between data, or add movement with an infographic slide in your presentation.

After

A designer-made infographic template that’s fully editable. Add your steps or data points by hand or let AI fill them in, and Smart Slides keep the arrow bars aligned as you edit.

Why: The live subhead describes use cases. The new one names what this template actually holds: arrow bars carrying steps or data points.

OptimizedCTA row
Before

Use this template

After

Use this template (kept, primary)  +  Fill it in with AI (new, secondary)

Why: “Use this template” matches what the searcher came for and stays primary. AI fill is the differentiator no printable or vector template site on this results page can offer, which earns it the secondary slot.

NewTemplate preview gallery
New

A band of static previews of this template in multiple slide themes, each opening the editor. The existing walkthrough video keeps its tile in the band and still plays on click.

Why: Every ranking competitor on this results page opens onto a gallery. On a page Google currently skips, crawlable image content is evidence it lacks today.

NewHow-to section
New

How to use the infographic template

  1. Open the template. “Use this template” opens it in the Beautiful.ai editor.
  2. Add your content. Type in the steps or data points each arrow bar carries, upload a document or data file, or describe the list and let AI fill the template.
  3. Make it yours. Adjust colors and labels; Smart Slides keep the layout aligned as you edit.
  4. Present or export. Share a live link, present in Beautiful.ai, or export to PowerPoint, Google Slides, or PDF.

Why: The winning template pages all walk the searcher from template to finished slide in numbered steps. Every step is a documented product behavior.

OptimizedOverview heading + placement
Before

H2 “Overview”, the first block after the hero.

After

H2 “What is an infographic slide, and when should you use one?”. Same copy, kept in full, moved below the new template layer. No closing sentence is appended; the kept copy already names the infographic slide template naturally.

Why: The overview copy is real, useful content and stays. The heading becomes the question searchers actually ask, and the block moves down so the page leads with what the searcher came for: the template.

UnchangedOverview body (kept in full)
Unchanged

Need to dress up a plain list of data? An infographic presentation slide displays your data in an interesting, impactful way. Instead of adding a regular bullet list to a slide, an infographic slide uses arrow bars to organize your data. Arrows can imply relationships or movement between data points, explain steps to achieve a goal, or make any list in your presentation look well-designed.

Use our infographic slide template to:

  • Share important data visually
  • Lay out steps in a process
  • Show relationships between different data

Why: The overview copy is real, useful content and stays word for word; only the heading changes and the block moves below the new template layer.

OptimizedPro tips + AI capabilities tabs
Before

“Pro tips” and “Discover AI capabilities” render inside a tab component; the second tab’s content sits behind a click.

After

Both blocks kept in full, laid out as stacked sections. One copy edit: “Discover AI capabilities for infographic” → “for infographics.”

Why: The AI block covers data summarization and trend detection, but the tab hides it from crawlers.

UnchangedTab content (kept in full)
Unchanged

Pro Tips for an Infographic Presentation Slide

Use an infographic presentation template to visually impart information. Make the most of this slide by following these suggested steps.

Label your infographic slide appropriately If you’re explaining steps in a process in your infographic slide, number each arrow. Comparing percentages? Place the percentage in or around each arrow.

Clearly represent your data A longer arrow bar implies a larger number or percentage. Make sure the size of each bar in your list is proportional to your data.

Get creative Give each arrow a unique color, add animations or transitions, or play around with fonts and sizing to make your infographic slide template pop.

Use it for more than one data point or idea One arrow in your infographic slide will look unfinished or like a mistake. Because it’s meant to stylize a list, make sure you have multiple points or steps to display.

Discover AI capabilities for infographic

With these AI-driven features, you can optimize your infographic in seconds to create more engaging, effective visuals.

Refine copy on an infographic slide Leverage AI to edit text within an infographic slide, no ChatGPT needed. AI can help create new text with a prompt, re-write existing text, and expand or shorten text length.

Summarize infographic data Collaborate with the AI assistant to craft the perfect narrative. The technology can summarize complex data into more digestible chunks.

Find trends and relationships in the data Ask the AI to identify trends or relationships in the data to add as an annotation or call out.

Create a supporting image Tell the AI what you’re looking for and generate an image that complements your infographic perfectly.

Why: Every tip and AI capability above ships unchanged; only the layout un-nests so the copy is visible without a click.

Optimized“Browse more templates” carousel
Before

Fifteen autoplaying Vimeo embeds from the Diagrams & Timeline category, including an Infographic Slide card that links back to this very page.

After

Static image cards with descriptive text links, “Pictograph template,” “Pyramid template”, with videos still available on click, and the self-referencing card dropped.

Why: The self-link wastes a slot, and fifteen autoplaying embeds dominate the page weight. Static cards with real anchors keep the breadth signal.

NewFAQ section (+ FAQPage schema)
New

Infographic template FAQ

Is the infographic template editable?

Yes. The template is a fully editable Smart Slide: add or remove arrow bars, edit their labels, and reorder them, and the layout adapts automatically as you work.

How do I add my own content?

Open the template and type in the steps or data points each arrow bar carries, or upload a document or data file and Beautiful.ai places your content on the slide.

Can AI fill it in for me?

Yes. Describe the list or process you are presenting, and the AI assistant fills the arrow bars with your steps or data points in place. You can keep editing everything afterward.

Can I export to PowerPoint or Google Slides?

Yes. Slides export to PowerPoint, Google Slides, or PDF, and you can also present or share a live link directly from Beautiful.ai.

When should I use an infographic slide?

An infographic slide works best when a plain list of data needs to land visually: sharing important data, laying out the steps in a process, or showing relationships between different data points, with arrow bars in place of a bullet list.

Why: Answers are product facts in this page’s own nouns, powering FAQPage schema (marker 3). No answer claims the template is free; the results page for this query markets free aggressively, and the honest counter is design quality and AI fill.

NewProgrammatic internal links
New

“More diagram & timeline templates”: every same-category sibling linked with a descriptive anchor (Pictograph template · Pyramid template · Process diagram template · Hub and spoke template …), plus the slide templates hub and the presentation software page.

Why: Winning “infographic template” back from the blog post requires this page to look like the canonical answer, and internal anchors are half of that argument.

UnchangedEverything below the carousel
Unchanged

The Smart Slides band, testimonials, template gallery band, and footer CTA below the carousel are site-wide template chrome, shared by every page on the site, and are unchanged.

Title tagmissing → carries the head term
Meta descriptionmissing → carries the head term
H1missing → carries the head term
How-to H2 + HowTo schemamissing → carries the head term
FAQ H2 + FAQPage schemamissing → carries the head term
BreadcrumbList + HowTo + FAQPage + VideoObject JSON-LD · generated from this page’s slots
[
  {
    "@context": "https://schema.org",
    "@type": "BreadcrumbList",
    "itemListElement": [
      {
        "@type": "ListItem",
        "position": 1,
        "name": "Slide templates",
        "item": "https://www.beautiful.ai/slide-templates"
      },
      {
        "@type": "ListItem",
        "position": 2,
        "name": "Diagrams & Timeline"
      },
      {
        "@type": "ListItem",
        "position": 3,
        "name": "Infographic Template",
        "item": "https://www.beautiful.ai/templates/infographic"
      }
    ]
  },
  {
    "@context": "https://schema.org",
    "@type": "HowTo",
    "name": "How to use the infographic template",
    "step": [
      {
        "@type": "HowToStep",
        "position": 1,
        "name": "Open the template.",
        "text": "“Use this template” opens it in the Beautiful.ai editor."
      },
      {
        "@type": "HowToStep",
        "position": 2,
        "name": "Add your content.",
        "text": "Type in the steps or data points each arrow bar carries, upload a document or data file, or describe the list and let AI fill the template."
      },
      {
        "@type": "HowToStep",
        "position": 3,
        "name": "Make it yours.",
        "text": "Adjust colors and labels; Smart Slides keep the layout aligned as you edit."
      },
      {
        "@type": "HowToStep",
        "position": 4,
        "name": "Present or export.",
        "text": "Share a live link, present in Beautiful.ai, or export to PowerPoint, Google Slides, or PDF."
      }
    ]
  },
  {
    "@context": "https://schema.org",
    "@type": "FAQPage",
    "mainEntity": [
      {
        "@type": "Question",
        "name": "Is the infographic template editable?",
        "acceptedAnswer": {
          "@type": "Answer",
          "text": "Yes. The template is a fully editable Smart Slide: add or remove arrow bars, edit their labels, and reorder them, and the layout adapts automatically as you work."
        }
      },
      {
        "@type": "Question",
        "name": "How do I add my own content?",
        "acceptedAnswer": {
          "@type": "Answer",
          "text": "Open the template and type in the steps or data points each arrow bar carries, or upload a document or data file and Beautiful.ai places your content on the slide."
        }
      },
      {
        "@type": "Question",
        "name": "Can AI fill it in for me?",
        "acceptedAnswer": {
          "@type": "Answer",
          "text": "Yes. Describe the list or process you are presenting, and the AI assistant fills the arrow bars with your steps or data points in place. You can keep editing everything afterward."
        }
      },
      {
        "@type": "Question",
        "name": "Can I export to PowerPoint or Google Slides?",
        "acceptedAnswer": {
          "@type": "Answer",
          "text": "Yes. Slides export to PowerPoint, Google Slides, or PDF, and you can also present or share a live link directly from Beautiful.ai."
        }
      },
      {
        "@type": "Question",
        "name": "When should I use an infographic slide?",
        "acceptedAnswer": {
          "@type": "Answer",
          "text": "An infographic slide works best when a plain list of data needs to land visually: sharing important data, laying out the steps in a process, or showing relationships between different data points, with arrow bars in place of a bullet list."
        }
      }
    ]
  },
  {
    "@context": "https://schema.org",
    "@type": "VideoObject",
    "name": "Infographic Slide Template - Beautiful.ai",
    "description": "Walkthrough of the infographic template Smart Slide in Beautiful.ai.",
    "embedUrl": "https://player.vimeo.com/video/409951961"
  }
]
Why: All four blocks generate from the same per-page content slots, so they scale mechanically across all 236 pages. The existing schema block’s url host gets aligned to www.beautiful.ai. The VideoObject covers the kept hero video; its thumbnailUrl comes from the client’s own video-indexing pipeline, which owns poster assets.

The Google result today · markers 1–2
🎨
Beautiful.ai
https://www.beautiful.ai › templates › infographic
Infographic Slide Template | Beautiful.ai | Beautiful.ai 1
List steps in a process, show relationships between data, or add movement with an infographic slide in your presentation. 2
https://www.beautiful.ai/templates/infographic
Full screenshot of the live Infographic template page with numbered annotation markers
3
4
5
6
7Template preview gallery: added here
8“How to use the infographic template”: added here
9
10
11
12Infographic template FAQ: added here
13Programmatic template links: added here
Everything below (Smart Slides, testimonials, footer) is site-wide and unchanged