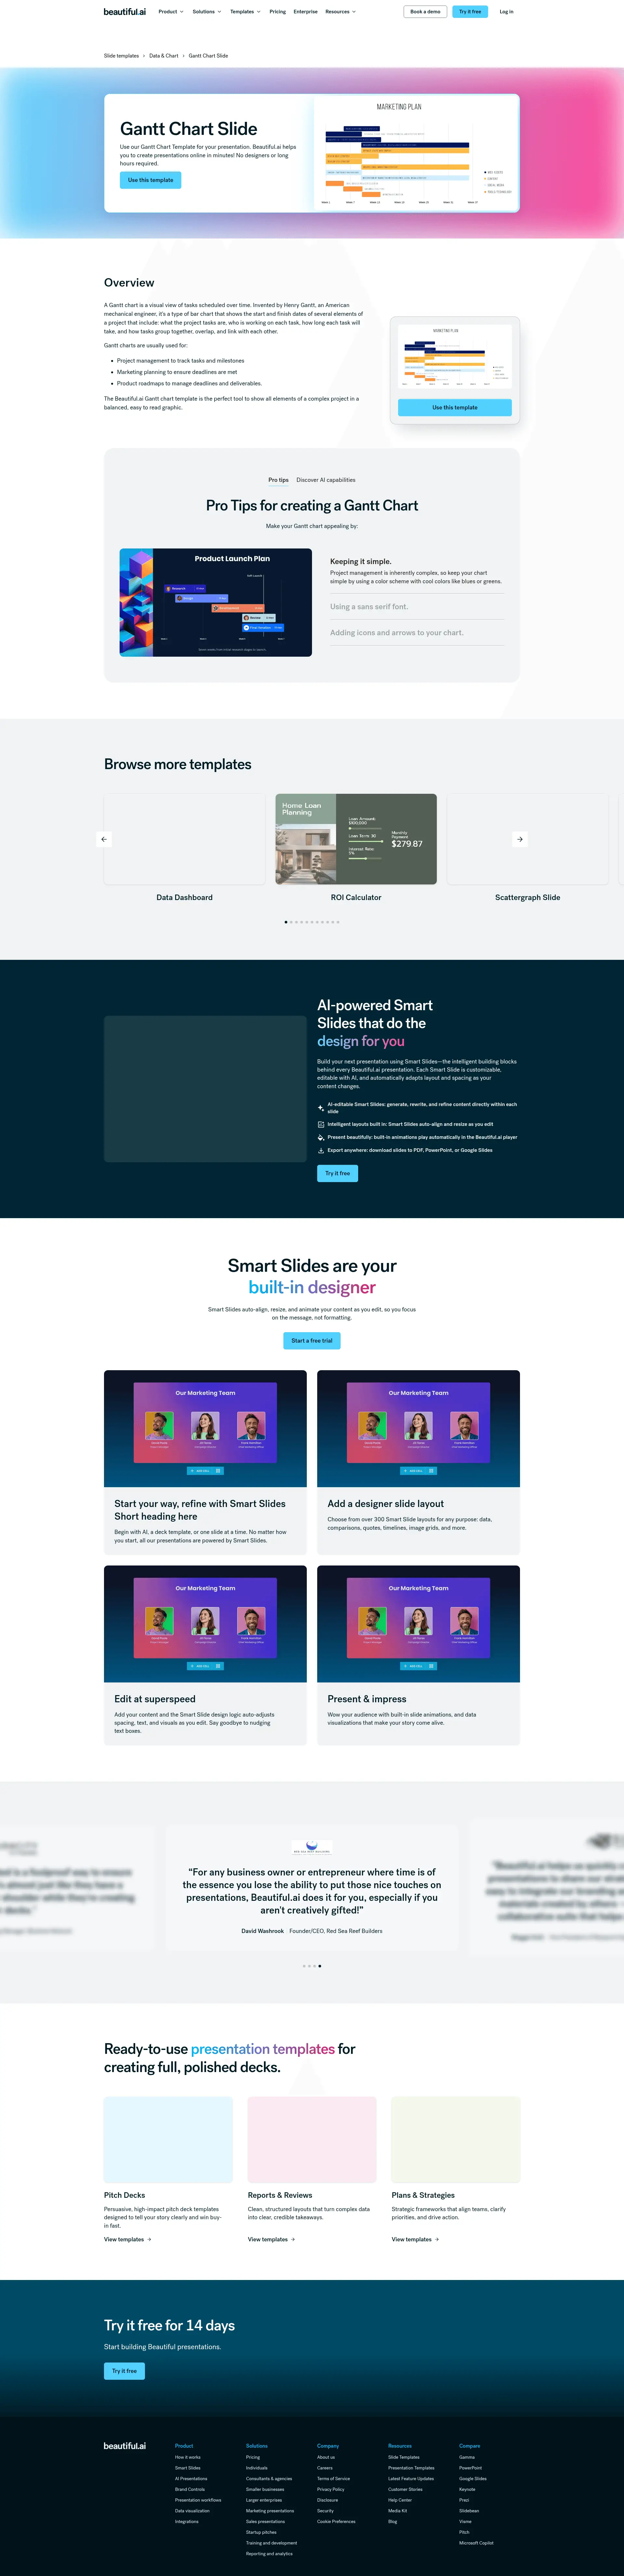
Two views of the same set of changes. Optimization Draft is the standard draft view, with the full before/after copy for every element in live page order and the paste-ready schema package. Annotated Before & After lays the same changes over a screenshot of the live page at beautiful.ai/templates/gantt-chart, taken August 24; click a numbered marker to jump to its card. The full module spec behind every change is on the review hub.
| Page URL | https://www.beautiful.ai/templates/gantt-chart |
| Category | Data & Chart (breadcrumb: Slide templates › Data & Chart › Gantt Chart Slide) |
| Head Term | gantt chart template |
| GSC Baseline | Not surfacing for “gantt chart template” in the 90-day baseline |
| Proposed Title Tag | Gantt Chart Template for Presentations | Beautiful.ai (53 chars) |
| Proposed Meta Description | Start from a designer-made Gantt chart template, add your tasks by hand or let AI fill it in, then take the finished slide to PowerPoint or Google Slides. (154 chars) |
| Summary | The page does not surface for “gantt chart template” in the 90-day baseline. The title drops “Slide,” clears the doubled brand, and commits to the head term; the separate gantt-chart-maker draft covers tool intent, so this page owns template intent cleanly. |
Why: The live H1 is “Gantt Chart Slide.” The searcher typed “gantt chart template,” and the headline should say so.
Use our Gantt Chart Template for your presentation. Beautiful.ai helps you to create presentations online in minutes! No designers or long hours required.
A designer-made Gantt chart template that’s fully editable. Add your tasks by hand or let AI generate the chart from a prompt, and Smart Slides keep the bars aligned as you edit.
Why: The live subhead is the boilerplate. The new one is true to this page’s own AI block, which includes generating a Gantt chart from a prompt.
Use this template
Use this template (kept, primary) + Fill it in with AI (new, secondary)
Why: “Use this template” matches what the searcher came for and stays primary. AI fill is the differentiator no printable or vector template site on this results page can offer, which earns it the secondary slot.
A band of static previews of this template in multiple slide themes, each opening the editor. The existing walkthrough video keeps its tile in the band and still plays on click.
Why: Every winner on this results page opens onto a gallery of editable variants; this page shows one chart behind a video embed.
Why: Project-management sites dominating this query all show a numbered path from template to finished chart. Every step here is a documented product behavior.
Why: The overview copy is real, useful content and stays. The heading becomes the question searchers actually ask, and the block moves down so the page leads with what the searcher came for: the template.
A Gantt chart is a visual view of tasks scheduled over time. Invented by Henry Gantt, an American mechanical engineer, it's a type of bar chart that shows the start and finish dates of several elements of a project that include: what the project tasks are, who is working on each task, how long each task will take, and how tasks group together, overlap, and link with each other.
Gantt charts are usually used for:
The Beautiful.ai Gantt chart template is the perfect tool to show all elements of a complex project in a balanced, easy to read graphic.
Why: The overview copy is real, useful content and stays word for word; only the heading changes and the block moves below the new template layer.
“Pro tips” and “Discover AI capabilities” render inside a tab component; the second tab’s content sits behind a click.
Both blocks kept in full, laid out as stacked sections. One copy edit: “Discover AI capabilities for Gantt chart” → “for Gantt charts.”
Why: The AI block covers prompt generation, document context, and deadline summarization, differentiated content the tab currently hides from crawlers.
Make your Gantt chart appealing by:
Keeping it simple. Project management is inherently complex, so keep your chart simple by using a color scheme with cool colors like blues or greens.
Using a sans serif font. Again, limit the complexity of your Gantt chart by using basic, easily readable fonts like Arial or Calibri. You can use free Google fonts which come with every Beautiful.ai account.
Adding icons and arrows to your chart. Highlight important tasks using our vast library of icons. This will make your chart easier to read and more visually appealing.
With these AI-driven features, you can optimize your Gantt chart in seconds to create more engaging, effective visuals.
Generate an AI Gantt chart with a prompt Generate an AI Gantt chart in just a few clicks. Simply prompt the AI assistant with the type of Gantt you’re looking to create and watch it come together automatically.
Add context with AI Add additional context to your prompt by uploading documents, or data, and the AI will use that to generate a Gantt chart that fits your story.
Refine copy on a Gantt chart slide Leverage AI to edit text within a Gantt chart, no ChatGPT needed. AI can help create new text with a prompt, re-write existing text, and expand or shorten text length.
Summarize project deadlines and deliverables Collaborate with the AI assistant to craft the perfect narrative. The technology can summarize project details, like deadlines and deliverables, into digestible chunks.
Why: Every tip and AI capability above ships unchanged; only the layout un-nests so the copy is visible without a click.
Twelve autoplaying Vimeo embeds from the Data & Chart category, including a Gantt Chart Slide card that links back to this very page.
Static image cards with descriptive text links, “Bar graph template,” “Waterfall chart template”, with videos still available on click, and the self-referencing card dropped.
Why: The self-link wastes a slot, and the autoplaying embeds dominate the page weight. Static cards with head-term anchors keep the breadth signal.
Is the Gantt chart template editable?
Yes. The template is a fully editable Smart Slide: add tasks, adjust start and finish dates, and reassign owners, and the bars stay aligned as you work.
How do I add my own tasks?
Open the template and type in each task, its owner, and its start and finish dates, or upload a document or data file and Beautiful.ai places your schedule on the slide.
Can AI fill it in for me?
Yes. Describe the project and its phases, and the AI assistant fills the template with tasks, owners, and dates in place. You can keep editing everything afterward.
Can I export to PowerPoint or Google Slides?
Yes. Slides export to PowerPoint, Google Slides, or PDF, and you can also present or share a live link directly from Beautiful.ai.
When should I use a Gantt chart?
A Gantt chart works best when a project’s tasks need to be seen over time: tracking tasks and milestones, planning marketing against deadlines, or managing a product roadmap’s deliverables. Bars show each element’s start and finish dates in one balanced graphic.
Why: Answers are product facts in this page’s own nouns, powering FAQPage schema (marker 3). No answer claims the template is free; most competitors on this query market free plans, and the honest counter is design quality and AI fill.
“More data & chart templates”: every Data & Chart sibling linked with its head term as anchor text (Bar graph template · Pie chart template · Waterfall chart template · Line chart template …), plus the slide templates hub and the data visualization page.
Why: The Data & Chart cluster currently crawls as disconnected pages behind “View template” labels. Head-term anchors fix that mechanically.
The Smart Slides band, testimonials, template gallery band, and footer CTA below the carousel are site-wide template chrome, shared by every page on the site, and are unchanged.
| Title tag | missing → carries the head term |
| Meta description | carries the head term → carries the head term |
| H1 | missing → carries the head term |
| How-to H2 + HowTo schema | missing → carries the head term |
| FAQ H2 + FAQPage schema | missing → carries the head term |
[
{
"@context": "https://schema.org",
"@type": "BreadcrumbList",
"itemListElement": [
{
"@type": "ListItem",
"position": 1,
"name": "Slide templates",
"item": "https://www.beautiful.ai/slide-templates"
},
{
"@type": "ListItem",
"position": 2,
"name": "Data & Chart"
},
{
"@type": "ListItem",
"position": 3,
"name": "Gantt Chart Template",
"item": "https://www.beautiful.ai/templates/gantt-chart"
}
]
},
{
"@context": "https://schema.org",
"@type": "HowTo",
"name": "How to use the Gantt chart template",
"step": [
{
"@type": "HowToStep",
"position": 1,
"name": "Open the template.",
"text": "“Use this template” opens it in the Beautiful.ai editor."
},
{
"@type": "HowToStep",
"position": 2,
"name": "Add your tasks.",
"text": "Type in each task, its owner, and its start and finish dates, upload a document or data file, or describe the project and let AI fill the template."
},
{
"@type": "HowToStep",
"position": 3,
"name": "Make it yours.",
"text": "Adjust colors and labels; Smart Slides keep the layout aligned as you edit."
},
{
"@type": "HowToStep",
"position": 4,
"name": "Present or export.",
"text": "Share a live link, present in Beautiful.ai, or export to PowerPoint, Google Slides, or PDF."
}
]
},
{
"@context": "https://schema.org",
"@type": "FAQPage",
"mainEntity": [
{
"@type": "Question",
"name": "Is the Gantt chart template editable?",
"acceptedAnswer": {
"@type": "Answer",
"text": "Yes. The template is a fully editable Smart Slide: add tasks, adjust start and finish dates, and reassign owners, and the bars stay aligned as you work."
}
},
{
"@type": "Question",
"name": "How do I add my own tasks?",
"acceptedAnswer": {
"@type": "Answer",
"text": "Open the template and type in each task, its owner, and its start and finish dates, or upload a document or data file and Beautiful.ai places your schedule on the slide."
}
},
{
"@type": "Question",
"name": "Can AI fill it in for me?",
"acceptedAnswer": {
"@type": "Answer",
"text": "Yes. Describe the project and its phases, and the AI assistant fills the template with tasks, owners, and dates in place. You can keep editing everything afterward."
}
},
{
"@type": "Question",
"name": "Can I export to PowerPoint or Google Slides?",
"acceptedAnswer": {
"@type": "Answer",
"text": "Yes. Slides export to PowerPoint, Google Slides, or PDF, and you can also present or share a live link directly from Beautiful.ai."
}
},
{
"@type": "Question",
"name": "When should I use a Gantt chart?",
"acceptedAnswer": {
"@type": "Answer",
"text": "A Gantt chart works best when a project’s tasks need to be seen over time: tracking tasks and milestones, planning marketing against deadlines, or managing a product roadmap’s deliverables. Bars show each element’s start and finish dates in one balanced graphic."
}
}
]
},
{
"@context": "https://schema.org",
"@type": "VideoObject",
"name": "Gantt Chart Slide Template",
"description": "Walkthrough of the Gantt chart template Smart Slide in Beautiful.ai.",
"embedUrl": "https://player.vimeo.com/video/395321376"
}
]Why: All four blocks generate from the same per-page content slots, so they scale mechanically across all 236 pages. The existing schema block’s url host gets aligned to www.beautiful.ai. The VideoObject covers the kept hero video; its thumbnailUrl comes from the client’s own video-indexing pipeline, which owns poster assets.